
Tired of property valuations that leave you guessing? In today's market, a single figure isn't enough. As the definitive source of UK property intelligence, Chimnie understands that leading insurers, lenders, and property experts need more - you need verifiable confidence in that number.
Traditional Automated Valuation Models (AVMs) often fall short, offering vague ranges or fixed percentages that don’t truly reflect the reliability of the underlying data for each unique property. This ambiguity hinders fast, smart decision-making.
At Chimnie, providing the Single Source of Truth means delivering data you can trust implicitly. That's why we've enhanced our free AVM capabilities by integrating Conformal Prediction - a cutting-edge technique, rarely applied at this scale within the property valuation sector, that adds a crucial layer of statistically guaranteed certainty to our valuations.
What is Conformal Prediction? Putting Confidence into Context
Forget impenetrable algorithms. Think of Conformal Prediction as adding a statistically robust "confidence gauge" to our valuations. Instead of just a price estimate, our enhanced AVM now provides a reliable value range and clearly states how confident we are that the true market value lies within it.
Imagine a highly accurate weather forecast stating an "85% chance of sunshine between 2 pm and 5 pm." Similarly, our Conformal Prediction AVM can now report, for example, "We are 85% confident the true value of this specific property is between £284k and £366k." (Example figure, actual ranges vary per property).
This isn't guesswork. It's a rigorous, mathematically sound method that analyses our model's performance against real-world data. Leveraging our exhaustive analysis of hundreds of datasets allows us to quantify uncertainty transparently, delivering a trustworthy measure of confidence tailored to each individual property. This reinforces our commitment to being your single source of truth.
Visualising the Truth: Understanding the Confidence Bands
The general concept is shown below for several properties (identified by UPRN):
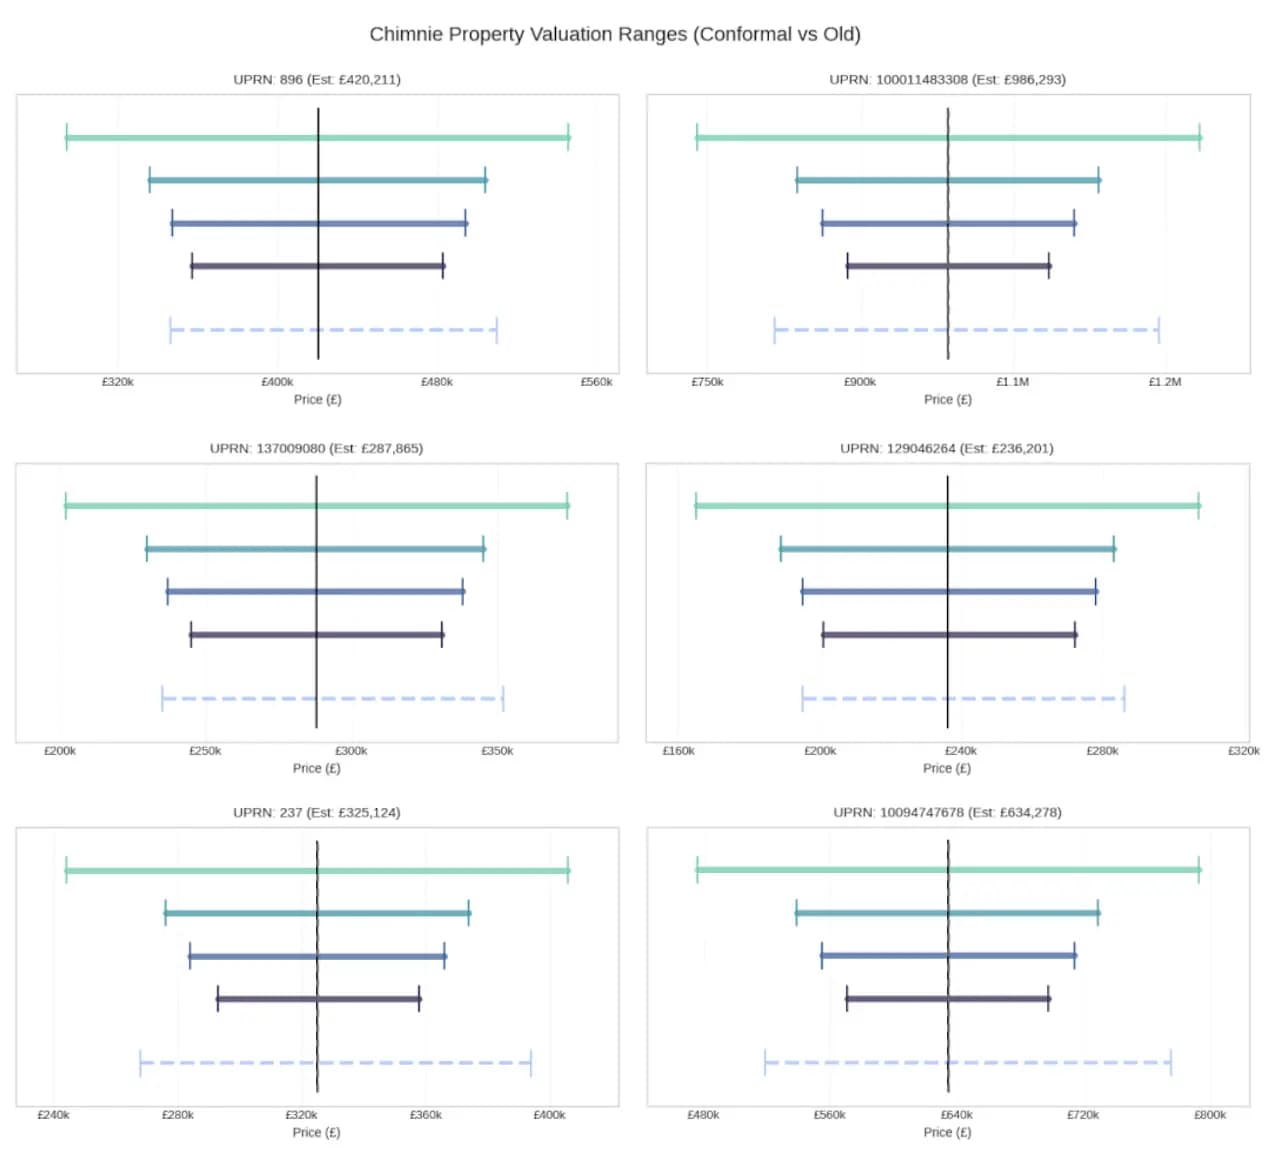
Figure 1: Chimnie's Conformal Prediction results for sample properties.
Solid Black Line: The central price estimate.
Coloured Bands (Shades of Teal/Blue/Purple): These represent different confidence intervals (80% to 95%). Wider bands indicate higher confidence (e.g. 95% - typically the lightest shade), while narrower bands represent slightly lower, but still robust, confidence levels (e.g. 80% - typically the darkest shade).
Dashed Line: Shows the range from our previous AVM methodology (~77% confidence).
These visuals clearly show how demanding higher confidence (like 95%) naturally results in a wider range, while an 80% confidence level provides a narrower, yet still statistically robust, window.
This highlights how the move to conformal prediction represents a significant technical advancement in property valuation methodology, balancing precision with statistically guaranteed uncertainty quantification.
Granular Control: A High-Value Example
Conformal Prediction offers sophisticated control. Let's examine a specific high-value property (UPRN: 100011483308) with a central estimate of £986,293. Instead of one fixed range, you get a clear progression, allowing you to match the confidence level to your specific task:
80% Confidence: Provides a range of £888k - £1.085m (a window of ~£197k). Ideal for rapid portfolio screening or initial market checks.
85% Confidence: Provides a range of £863k - £1.110m (a window of ~£247k). Suitable for standard property transactions and portfolio reviews.
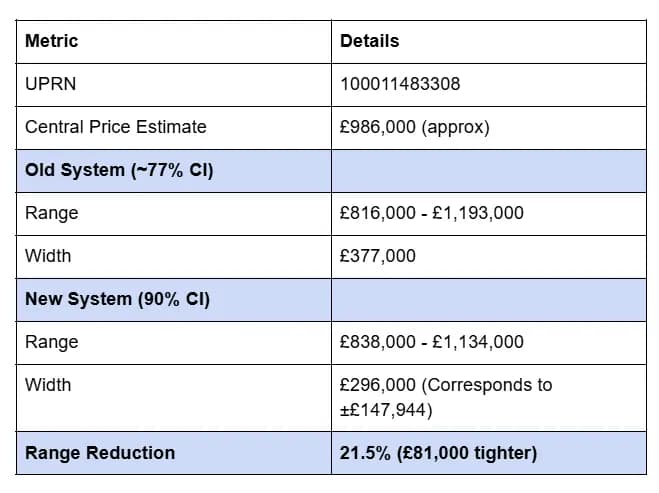
90% Confidence: Provides a range of £838k - £1.134m (a window of ~£296k). Recommended for core mortgage lending decisions and detailed underwriting.
95% Confidence: Provides a range of £740k - £1.233m (a window of ~£493k). Appropriate for high-stakes deals, complex risk assessment, or where maximum certainty is required.
This granular approach empowers your teams to make informed decisions aligned with their risk appetite, particularly crucial for high-value assets.
How Our New Valuation Model Delivers Superior Property Valuations at Every Confidence Level
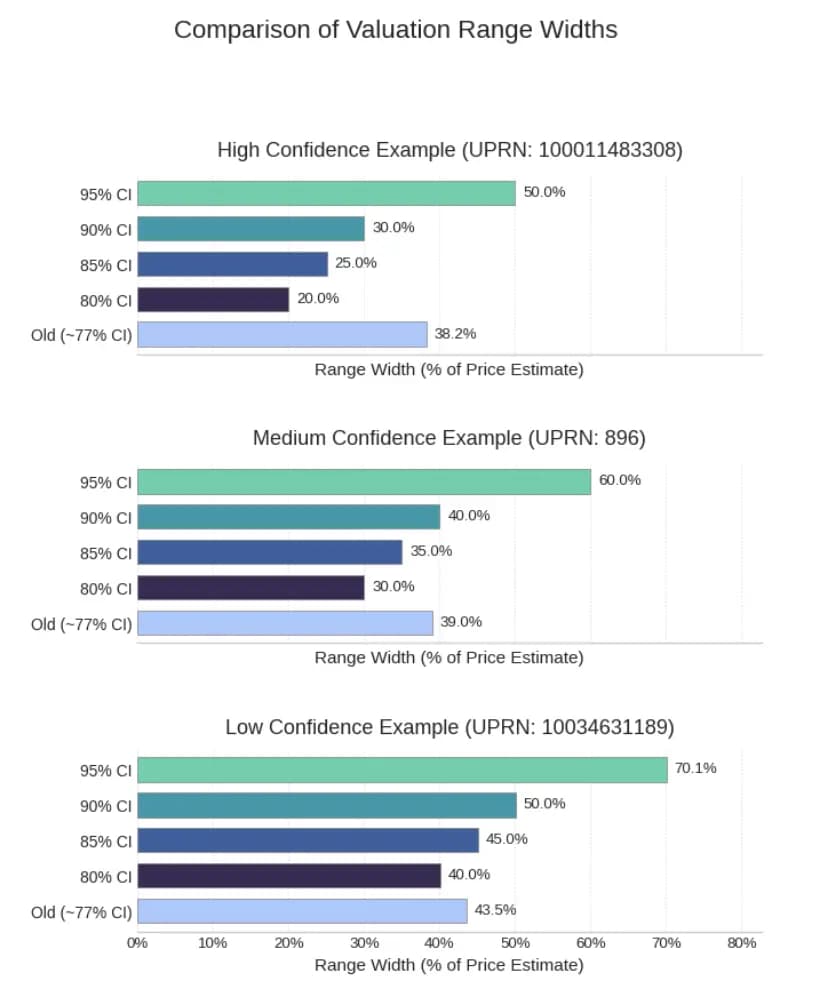
Figure 2: Comparing prediction range widths (% of price estimate) for three different confidence levels
This figure contrasts the new conformal prediction intervals (80%–95% CI) with the previous AVM’s static ~77% confidence range. As confidence levels increase, range widths expand — a natural trade-off in uncertainty quantification. Notably, the conformal model dynamically adjusts interval widths based on how confidently it can estimate each property's value. In high-confidence cases, even a 90% CI can be narrower than the old model, offering more precise insights. Meanwhile, broader ranges for low-confidence cases highlight the model’s adaptability, enabling better-informed decisions across varying scenarios.
Here’s a detailed analysis:
High Confidence Example (UPRN: 100011483308)
The old method produced a 38.2% range width at ~77% confidence, while the new approach achieves 80% confidence with just 20% range width.
The progression between confidence levels (20% → 25% → 30% → 50%) shows well-calibrated quantile regression, indicating the model is properly capturing the property's uncertainty distribution.
Medium Confidence Example (UPRN: 896)
The old methodology's 39.0% range width at ~77% confidence has been technically refined, allowing for an 80% confidence interval at just 30% width.
The more linear progression between confidence levels (30% → 35% → 40% → 60%) indicates a more normal uncertainty distribution compared to the high-confidence example.
Low Confidence Example (UPRN: 10034631189)
Despite higher overall uncertainty, the method still achieves meaningful improvements: 80% confidence intervals (40% width) are narrower than the old 43.5% width at ~77% confidence.
The wide 95% CI (70.1%) accurately represents heightened uncertainty, likely due to limited comparable data, unusual property features, or volatile market conditions.
Conformal prediction has transformed our valuation approach by delivering mathematically guaranteed confidence levels with optimized range widths across all property types, enabling more precise decision-making while maintaining statistical rigor that adapts intelligently to each unique valuation scenario.
The Chimnie Advantage: Smarter Decisions, Faster Workflows
This innovation translates directly into tangible benefits, moving beyond a "one-size-fits-all" approach:
Intelligence Tailored to Data Quality: We now dynamically provide the most appropriate confidence level based on the quality and recency of data for each property:
High Confidence Properties (e.g. recently sold): Receive a tight 90% confidence range, ideal for fast-tracking low-risk decisions (like the £838k - £1.134m range shown above).
Medium/Low Confidence Properties: Receive a robust 85% confidence range, providing a reliable assessment even with less recent comparable data.
Enhanced Accuracy & Reliability: More Confidence, Often Tighter Ranges: Our internal analysis shows a remarkable outcome: even as we increase the statistical confidence (to 85% or 90%), the resulting value ranges are often tighter than our previous method provided at its lower ~77% confidence level. This means you get greater certainty within a more precise valuation window - a core part of delivering the 'truth'.
Concrete Example: Recently Sold Property (High Confidence Scenario - UPRN 100011483308)
Sharper Risk Assessment: Price insurance policies, evaluate loan security, or assess asset value with a clearer understanding of potential variance. Make quicker, more robust credit risk assessments knowing the statistically defined boundaries of likely value, choosing the confidence level appropriate for the task.
Increased Trust & Transparency: Move beyond opaque models. Our Conformal Prediction ranges offer clear, statistically valid confidence levels, aligning with our value of total transparency and providing outputs you can genuinely rely on. While academically established, applying Conformal Prediction to provide guaranteed confidence ranges across millions of UK properties represents a significant step forward for practical valuation intelligence.
Leading with Cutting-Edge, Trustworthy Technology
By implementing Conformal Prediction at scale, Chimnie reinforces its position as a technology leader and your trusted partner. This isn't just a tweak; it's a fundamental enhancement to the reliability and actionability of our data, making our "Single Source of Truth" even more definitive.
We're committed to providing not just exhaustive data, but the intelligence and confidence needed to make faster, smarter decisions in today's complex market. Unlock a new level of certainty in your property assessments.
Ready to leverage property intelligence with verifiable confidence? Contact us at hello@chimnie.com to discuss how our enhanced AVM can empower your organisation.